Reefer fleet — 6 trailers
A regional food & flower distributor · last 24 h · three zones per trailer (front, middle, rear) · alerts first
Trailer
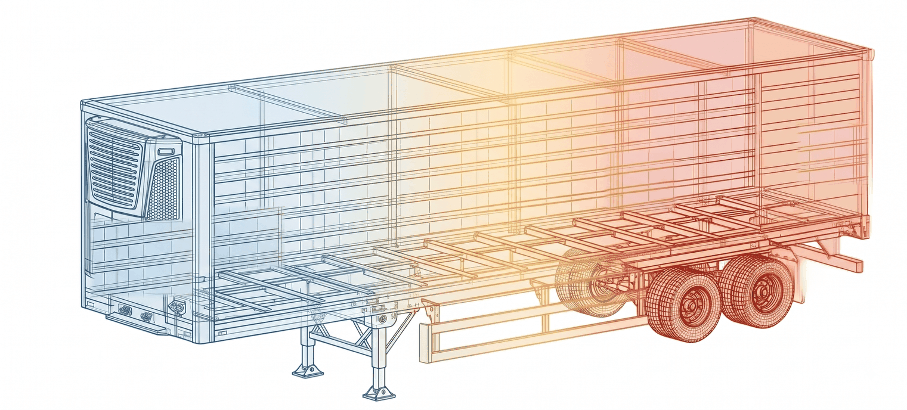
Now
Temperature by zone · last 24 h · °F
ambient, doors and cooling on the same timelineFront–middle–rear spread · °F
How evenly the box is cooled. A widening spread points to blocked airflow, a load against the doors or an insulation leak.
Cooling effort · estimated, per hour
Estimated from how the box temperature behaves against ambient. Flags a unit that stops cycling, overworks or short-cycles.
Excursion & event log
every deviation with its duration, place and probable cause| Start | Duration | What | Zone | Peak | Where | Probable cause |
|---|
Parameters · set by your quality team
Change a value: the chart, the alerts and the log above are recalculated for this trailer.
Trailer grading & energy
insulation and cooling effort, trailer by trailer| Trailer | Insulation grade | Warm-up with unit off | Cooling effort · 24 h | Predicted · tomorrow's run |
|---|
The energy prediction learns each trailer, route and weather over its first 3–4 weeks. Tomorrow: high 86 °F, sunny. Figures are kWh of cooling, estimated.
Already running on live daXos units
real measurements · box truck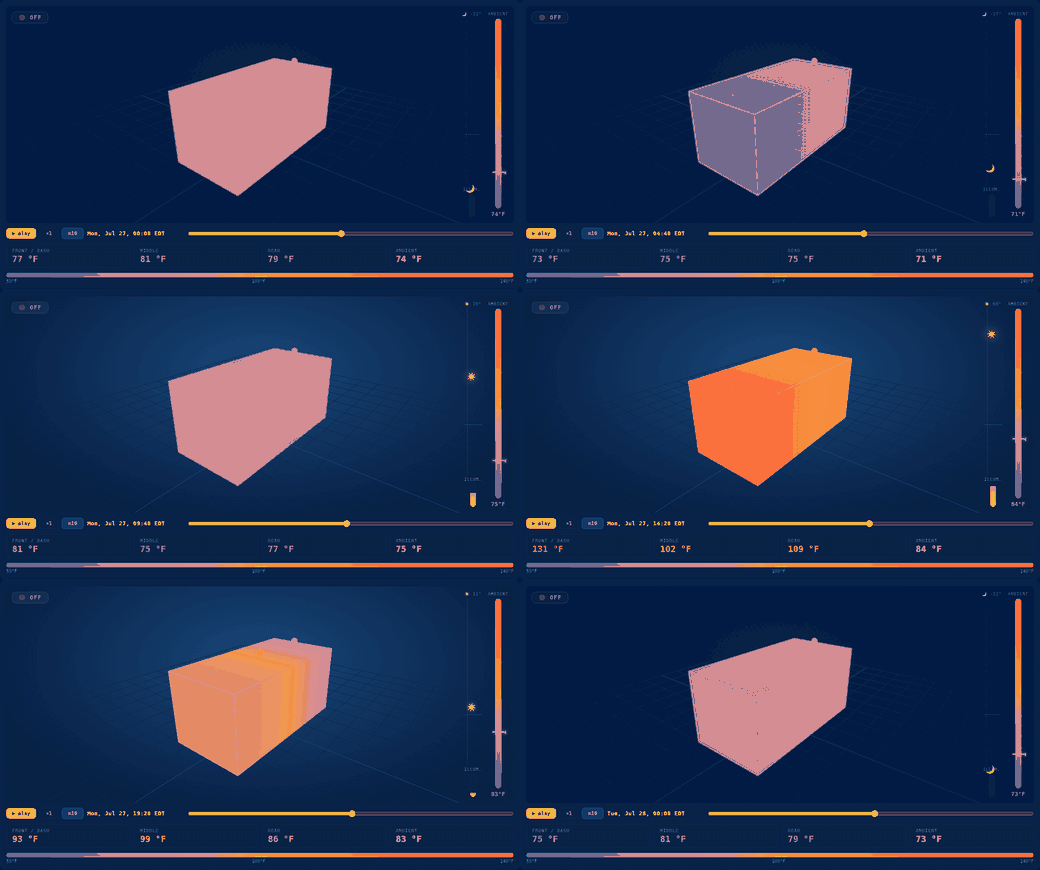
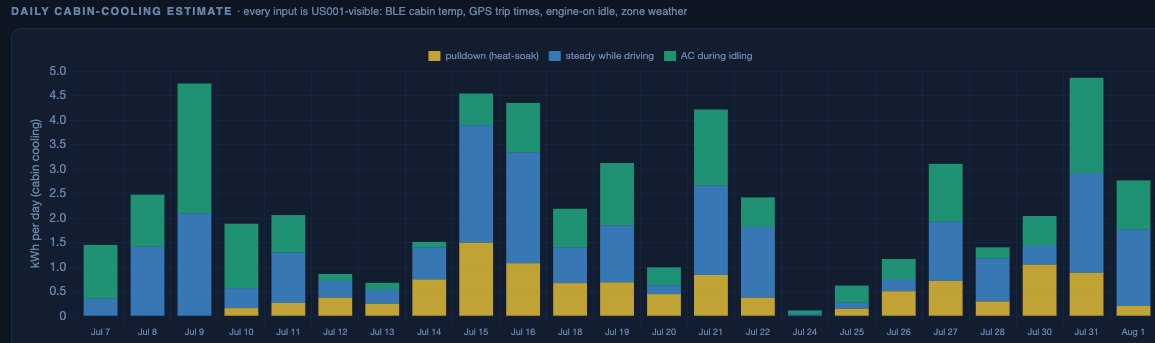
The 3D thermal replay and the daily cooling-energy chart above are real measurements from a box truck. The six trailers in the fleet view are sample data. Cooling effort and energy are estimates.